Is it a blue tidal wave, or are Republicans not answering polls… again?
Wick ran a new recontact study to explain what that phrase means and how much we might be seeing it again.
David Burrell · Wick · October 2026
Illustration, not data. For decades, polling error stayed in a fairly narrow range. Around 2014 it widened, and it has stayed wide. What changed? Not the math. The incentive to answer a poll.
Our recontact study shows one part of the problem: an incentive to answer polls that didn't exist until recently. It adds a hidden bias of 3.3 points toward Democrats on the margin and understates Trump's net favorability by 3.2 points. Even weighting to results we already had couldn't eliminate either one.
The study
We sent a new survey to 16,358 people from our accurate late-October polls.
16,358 invited
from accurate late-October polls in 2022 and 2024
Recontacted October 2026
1,874 came back
from states with competitive races in 2026
510 came back
from Pennsylvania, with no competitive race in 2026
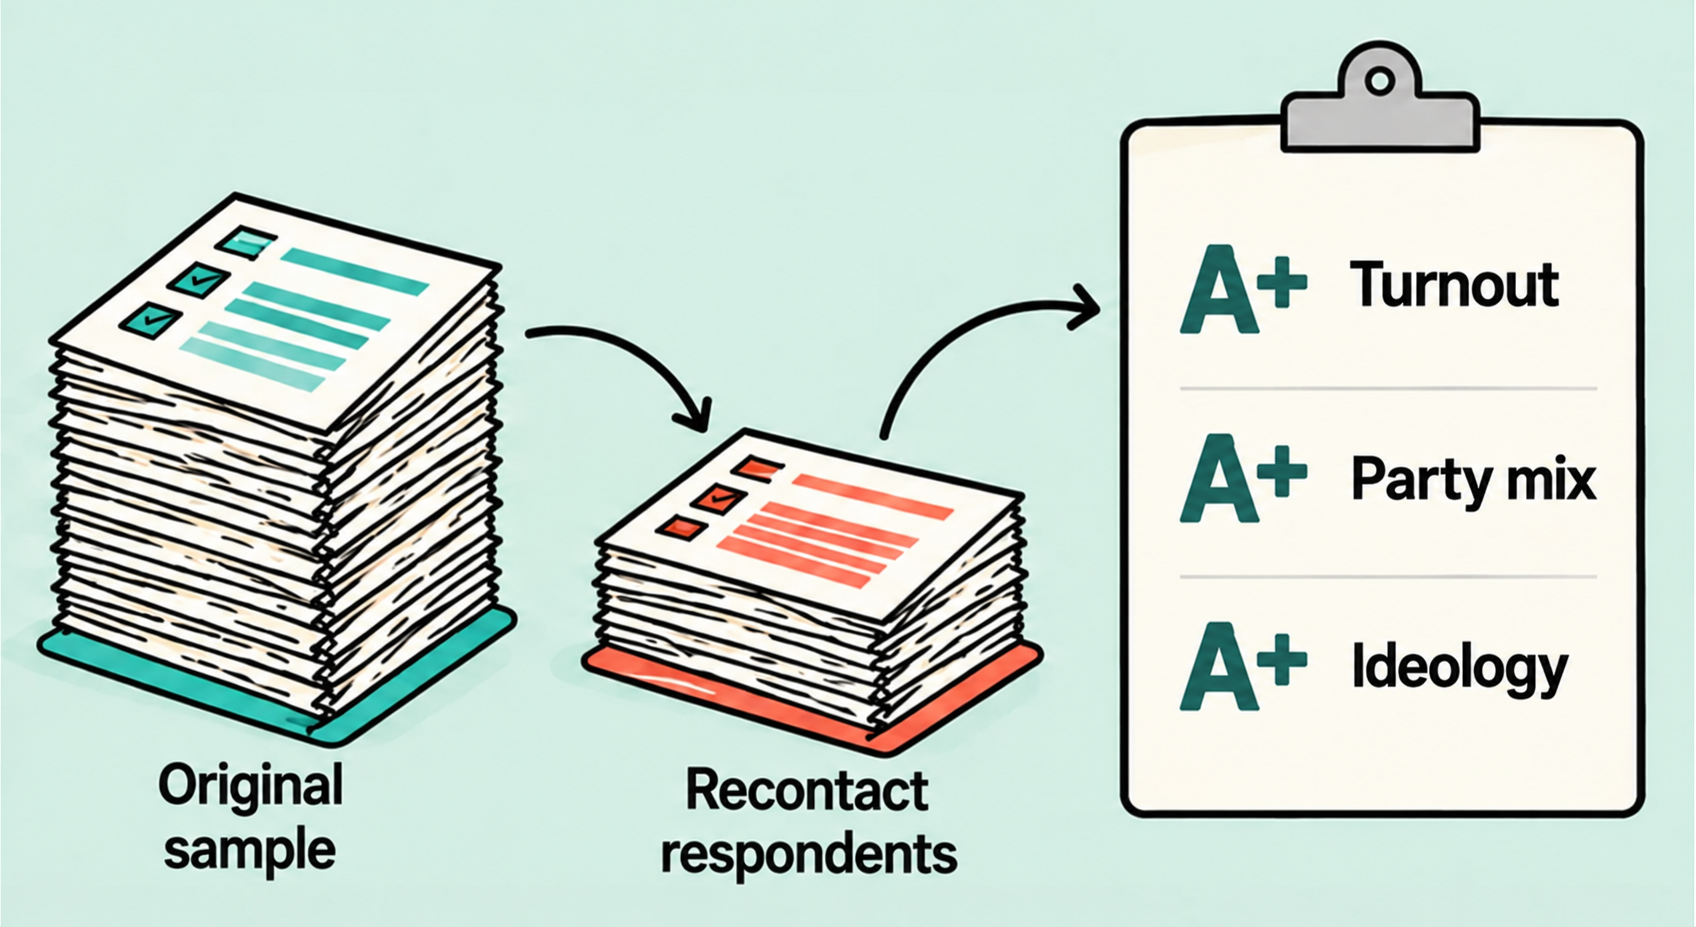
This is the study. We used our 2022 and 2024 text-to-web polls in Arizona, Florida, Georgia, Michigan, North Carolina, Pennsylvania, South Carolina and Tennessee: 16,358 respondents, mostly from mid-to-late October, from polls that came close to the final result.
In October 2026 we invited all of them to take a new survey. 2,384 came back, or 14.6%. That is well above the 1% or 2% typical for a new poll, because they had taken our surveys before.
2,384 came back in all: 1,874 from the states with competitive races in 2026, and 510 from Pennsylvania, our comparison state with no competitive statewide race.
Because we have everyone's original answers, including the people who didn't come back, we can compare the two groups directly. Normally a pollster knows nothing about the people who don't respond.
The study
We gave weighting the best possible test.
A normal poll
Has to guess who will vote. Even after the election, there's no true count of ideology.
Our test
We had everyone's original answers, so we weighted the people who came back to match them exactly.
This is the best case for weighting. A normal pre-election poll is predicting a result that hasn't happened yet. It has to estimate turnout and the party mix, and there's no true benchmark for ideology, even after an election.
We didn't have to guess. We had the original answers of everyone we invited, so we weighted the people who came back to match them exactly on age, sex, race, education, urbanicity, party, ideology and 2020 vote recall.
Then we checked their old ballot answers, which weren't part of the weighting. If weighting could fix the problem, those should have matched too. They didn't.
The study
What the study tells us
01Real shifts
Changes in the same people, beyond shifts in party shares.
4–5 point shifts in House and Senate
02Who’s missing?
Evidence on whether we’re undercounting Republicans again.
3–4 point nonresponse bias
03Why people answer
Changing incentives in an always-on world of smartphones and social media.
Coincides with the mass adoption of smartphones and social media
This is the guide to the three sections that follow. First, compare the same respondents’ earlier and current answers to observe individual-level movement, rather than inferring movement from changes in category shares. The reported shifts remain findings among recontact respondents. Second, use the original answers of everyone invited to examine whether the people returning in 2026 leave a different mix within parties, including patterns consistent with undercounting Republicans. Third, discuss changing incentives to participate in polls as an always-on political narrative coincides with the mass adoption of smartphones and social media. This is a temporal association, not an attribution of blame to the media or proof of causation. The incentive explanation is an interpretation of the evidence and the conceptual illustrations, not a randomized causal finding. The self-reported survey-frequency comparison is an additional association in the 2026 recontact. Illustrations are conceptual, not measured transitions or quantities.
Real shifts
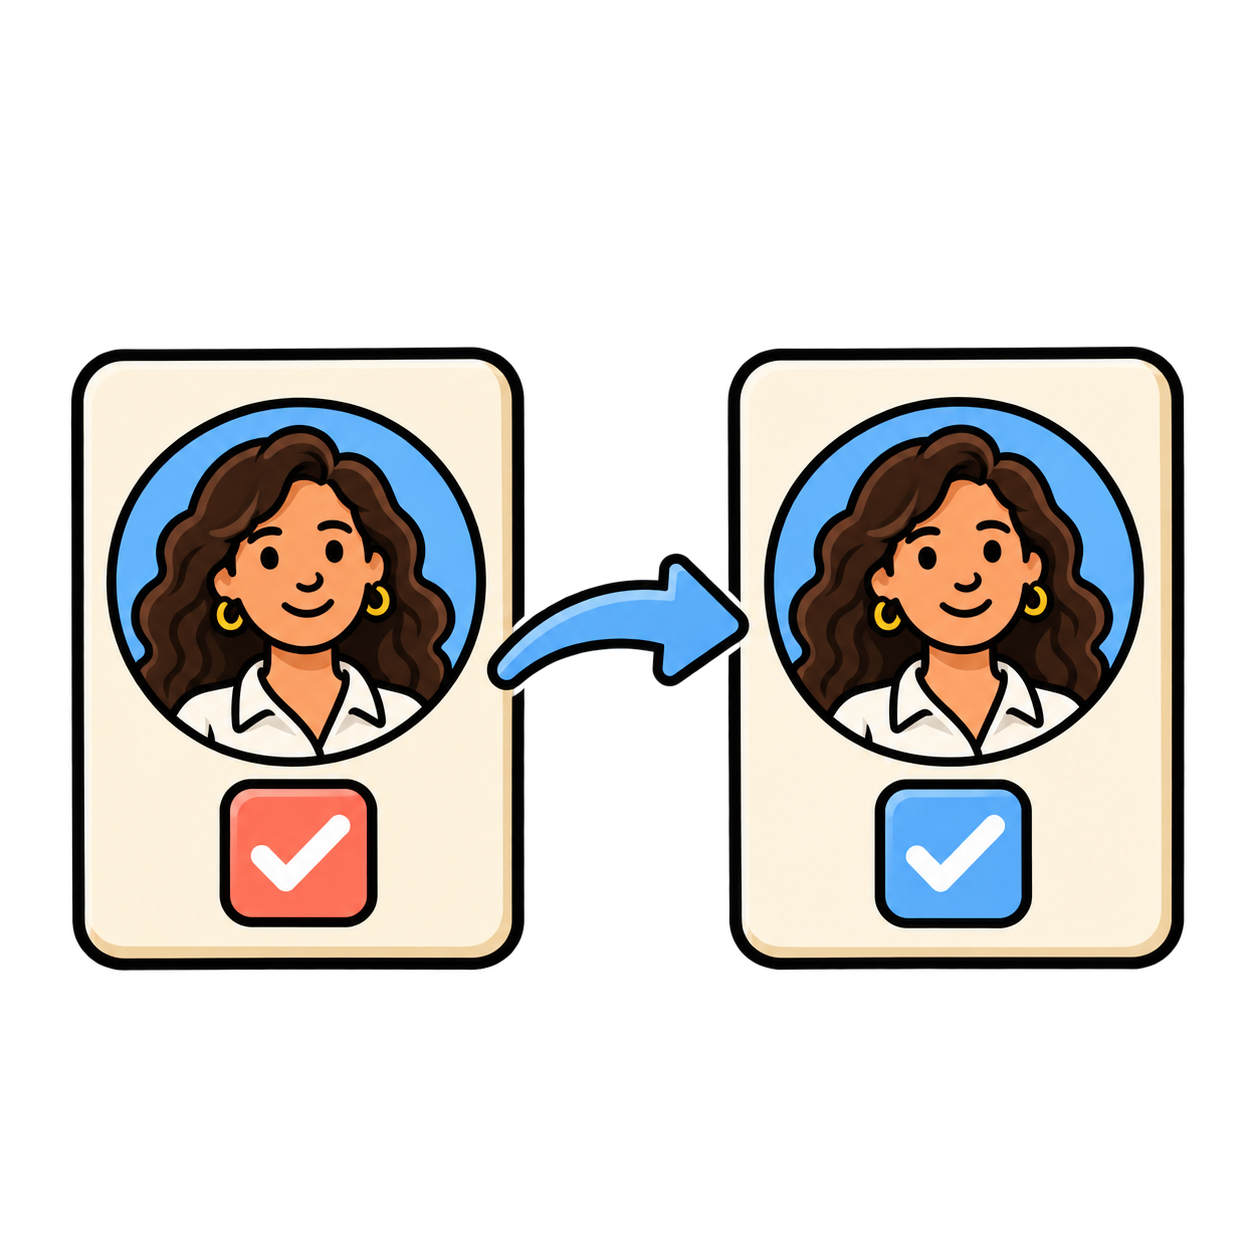
Recontact showed a major swing left.
The same voters, compared with their 2022 and 2024 answers.
Senate & House
4–5 points more Democratic
A 2028 template
Ossoff showing how to do it in GA.
Republicans
No positive shifts to report
Governor’s races
More neutral than federal races
How much of this is real, and how much are we just undercounting Republicans again?
→
The recontact shows a major leftward swing among people who took the accurate 2022 and 2024 surveys. The same 2024 respondents are 4 to 5 points more Democratic in 2026 Senate and House races than in their 2024 presidential vote. The 2022 cohort also moved toward Democrats; do not imply that the same 4-to-5-point figure applies identically to every comparison. Ossoff is holding nearly all of Warnock’s voters and adding former undecided and third-party voters, and some former Republican voters: a coalition-building template for Democrats. There are no positive Republican shifts to highlight in this recontact readout. Governor’s races show more neutral movement than federal races. These are findings among recontact respondents; the next section asks how much reflects real change and how much reflects nonresponse bias. The survey-frequency and hidden-bias discussion is intentionally separate from these four observations. Illustrations carry the concepts; all findings and numbers are native slide text. Source: research-hidden-nonresponse-2026-polls.html, the recontact’s other findings; four-point editorial framing requested by David.
Are the shifts real?
But are we undercounting Republicans in our polls?
Two sources of polling error
Wrong share
Quota error
Polling quota
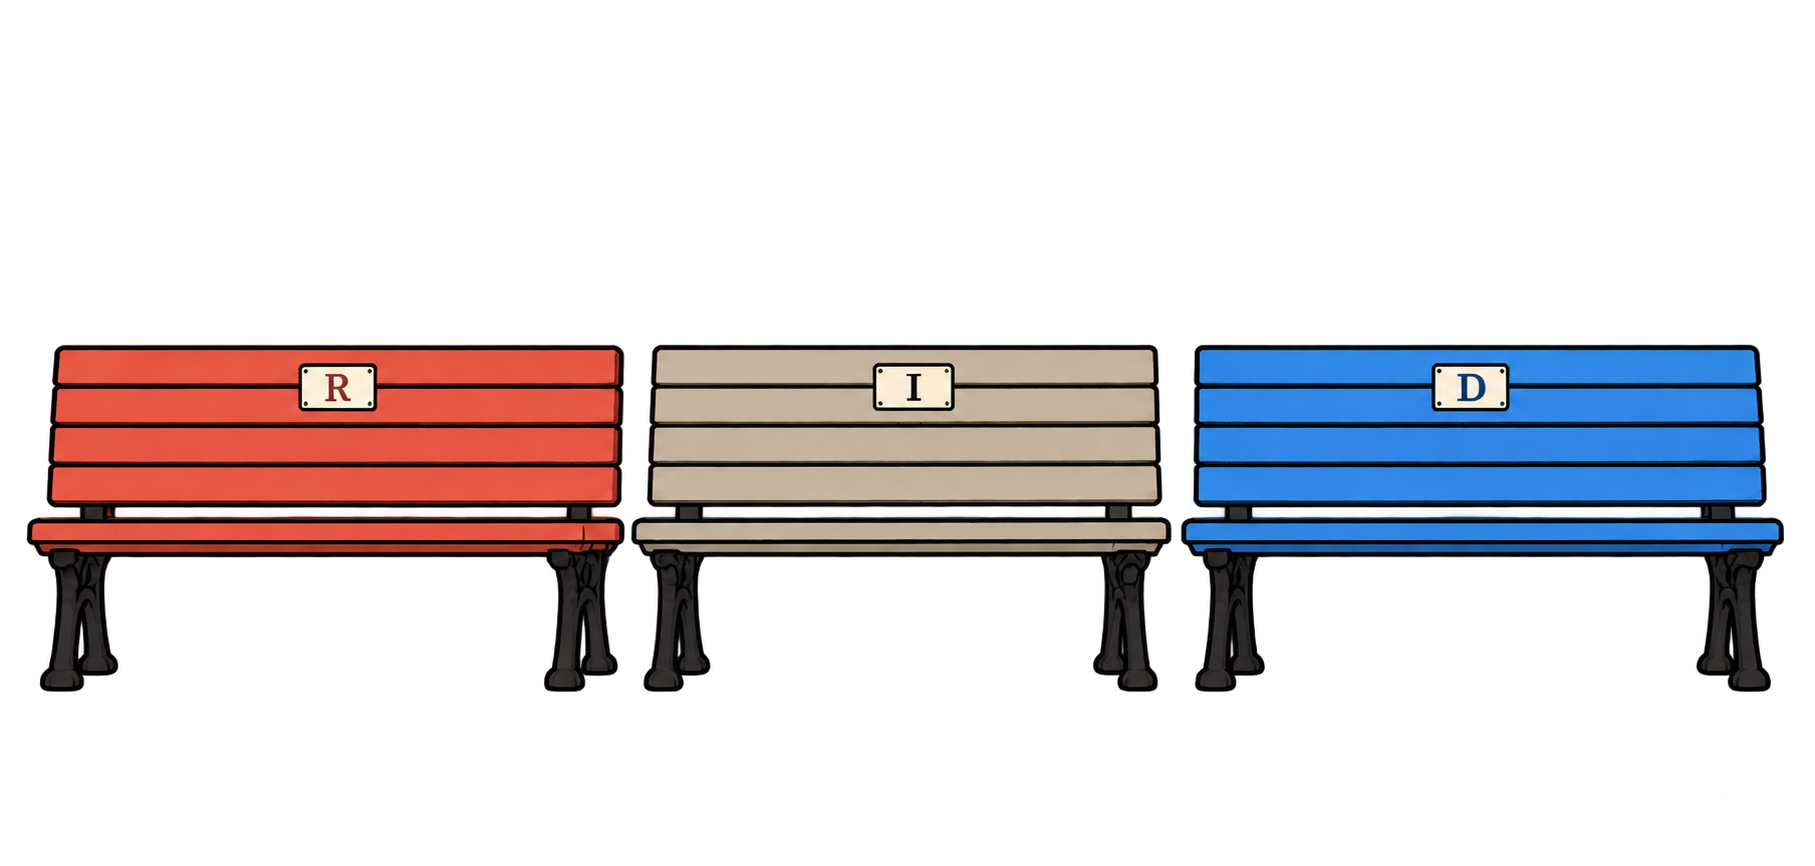
30%R30%D40%I
Voting electorate
34%R29%D37%I
The poll uses outdated party shares or misjudges turnout by party.
Wrong mix
Nonresponse error
Polling mix
50%Traditional50%MAGA
Voting electorate
40%Traditional60%MAGA
The poll has the wrong mix within a party.
These are illustrative examples, not measured electorate estimates. Quota error is used here as a plain-language label for incorrect target shares. Nonresponse error is a standard survey-error category; this example concerns differential response within Republicans. These are two sources of error, not an exhaustive or mutually exclusive taxonomy: nonresponse can also distort overall party shares.
Wrong share means the polling quota sets party shares at 30 Republican, 30 Democrat and 40 Independent, while the voting electorate is 34, 29 and 37.
Wrong mix happens within those shares. In this Republican example, the poll is half Traditional and half MAGA, while the electorate is 40 percent Traditional and 60 percent MAGA. Matching the overall Republican share does not necessarily correct the mix of Republicans who answer.
The wrong mix within Democrats
Democrats: original answers, recontact response pattern, and 2026 outcomes.
Democrats2022 / 2024 answer
Recontact response2026 response rate
2026 recontact answered…
Would vote R for HouseApprove of Donald Trump
’22/’24 top issueThreats to democracy
Too high
0.3%
0.0%
’22/’24 top issueOther issue
Too low
8.1%+7.8 pp
9.4%+9.4 pp
Democrats whose top issue was threats to democracy were 47.9% of everyone invited and 56.6% of the weighted recontact responses. Source: existing deck charts s2 and s4a, also reproduced in research-hidden-nonresponse-2026-polls.html. Groups are defined by their original answers. House ballot and Trump job approval are measured in the 2026 recontact. The characters illustrate subgroup averages.
The wrong mix within Republican men
Republican men: original answers, recontact response pattern, and 2026 outcomes.
Republican men2022 / 2024 answer
Recontact response2026 response rate
2026 recontact answered…
Would vote R for HouseApprove of Donald Trump
’22/’24 answeredVaxxed
Too high
74.8%
69.9%
’22/’24 answeredUnvaxxed
Too low
90.5%+15.7 pp
82.9%+13.0 pp
Vaccinated men were 49.7% of everyone invited and 63.4% of the weighted recontact responses. Source: existing deck charts s2 and s4c, also reproduced in research-hidden-nonresponse-2026-polls.html. Groups are defined by their original answers. House ballot and Trump job approval are measured in the 2026 recontact. The characters illustrate subgroup averages.
The wrong mix within Independents
Independents: original answers, recontact response pattern, and 2026 outcomes.
Independents2022 / 2024 answer
Recontact response2026 response rate
2026 recontact answered…
Would vote R for HouseApprove of Donald Trump
’22/’24 ideologyModerate
Too high
32.4%
28.1%
’22/’24 ideologyOther ideology
Too low
54.2%+21.8 pp
41.5%+13.4 pp
Moderate Independents were 49.5% of everyone invited and 57.4% of the weighted recontact responses. Source: existing deck charts s2 and s4b, also reproduced in research-hidden-nonresponse-2026-polls.html. Groups are defined by their original answers. House ballot and Trump job approval are measured in the 2026 recontact. The characters illustrate subgroup averages.
Trump approval by survey frequency
Independents from our 2022 and 2024 polls · 2026 recontact
These are people who took our 2022 or 2024 polls and called themselves Independents then. In the 2026 recontact we asked how often they take political surveys and whether they approve of Trump's job.
In the close-race states, Trump approval falls as survey-taking rises: 40% among those who rarely take surveys, 34% a few times a year, and 22% monthly or more. This is an association with self-reported survey frequency; it does not establish how often polls actually hear from these respondents.
Weighted the same way as the study. Close-race groups: 117, 180 and 129 people. "Rarely" means never or once in the past year; "monthly or more" includes several times a month.
Why polls get party shares wrong
1Not adjusting quotas for party composition
✓
+3.1points
What we do know
Registration points to Republican gains on the margin in swing states since 2022.
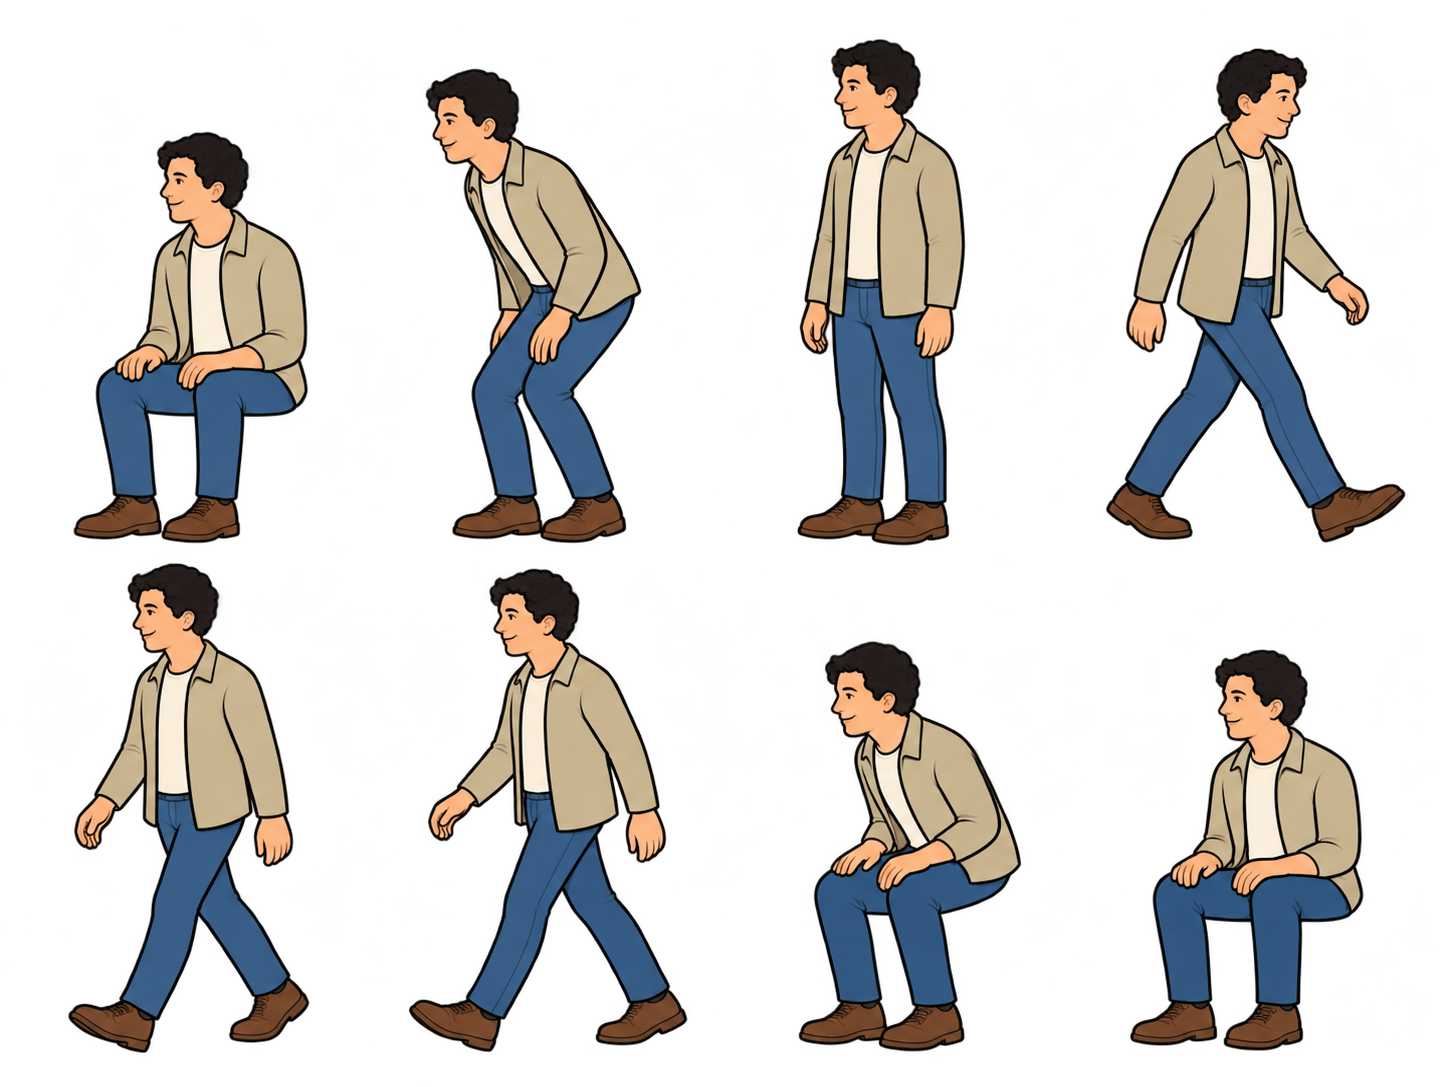
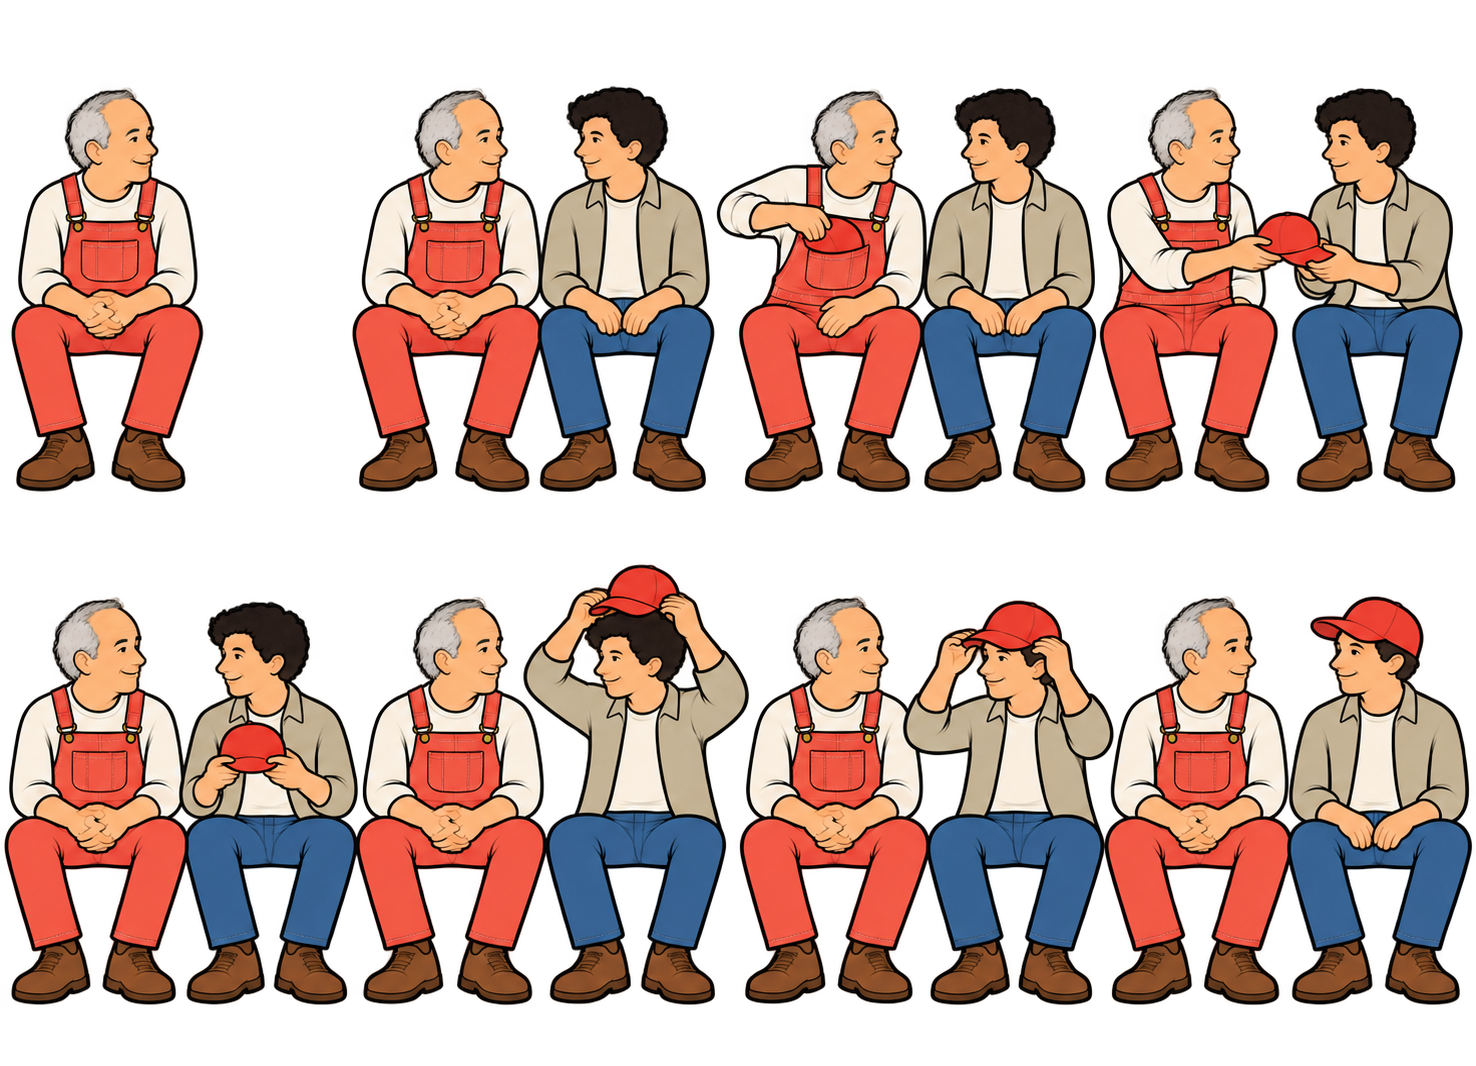
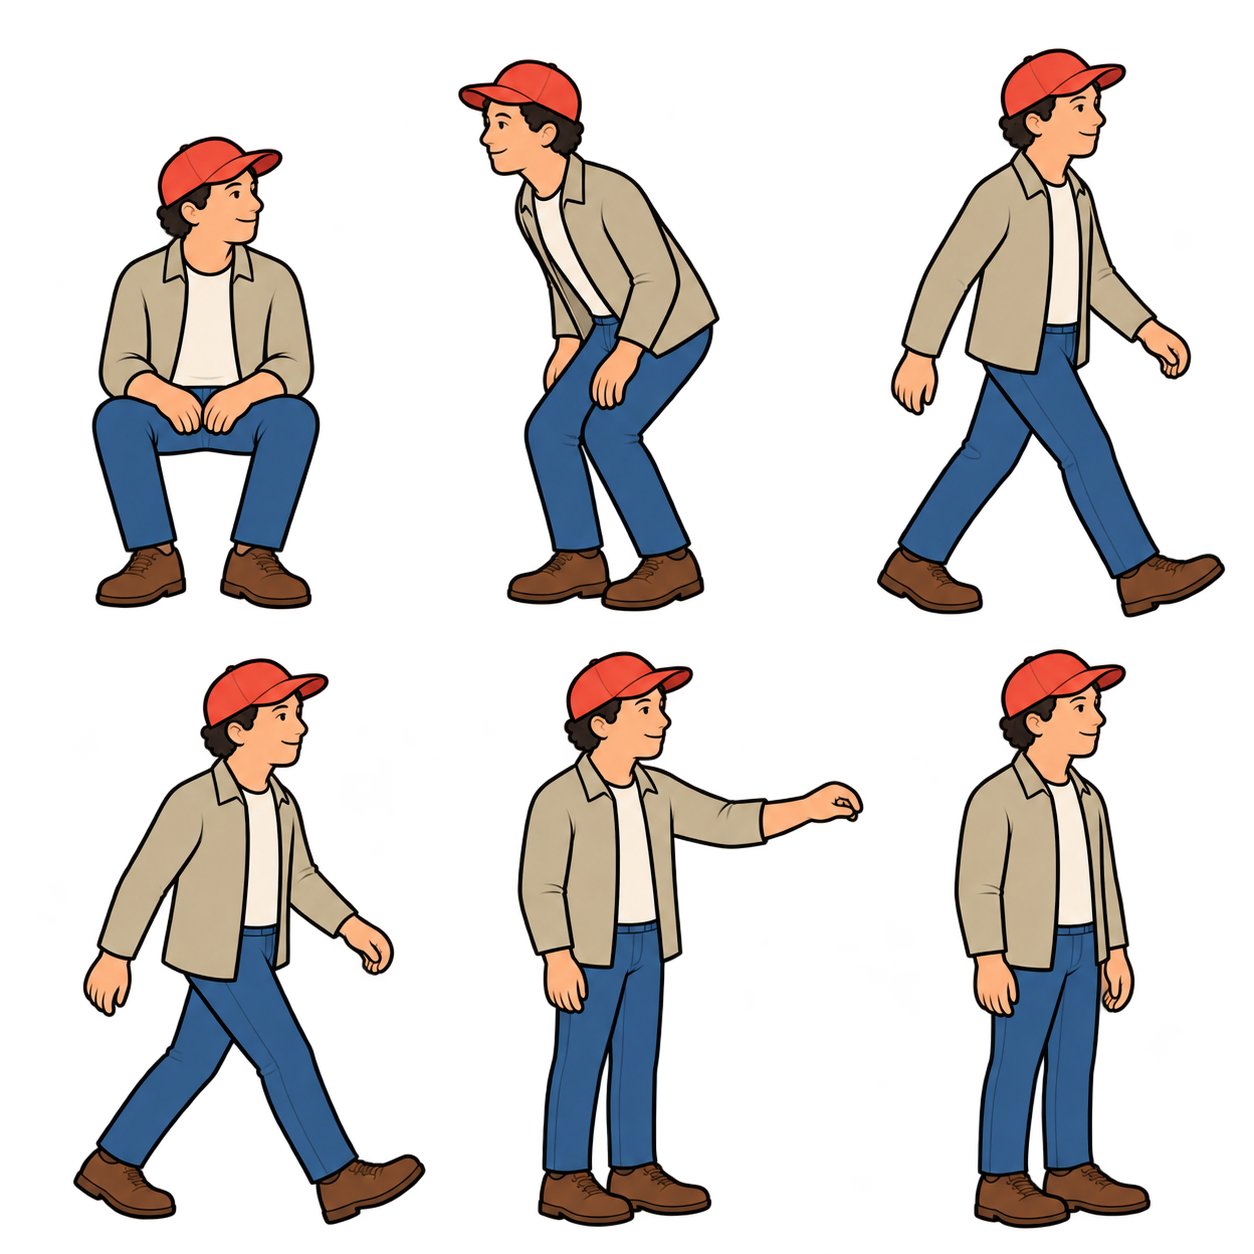
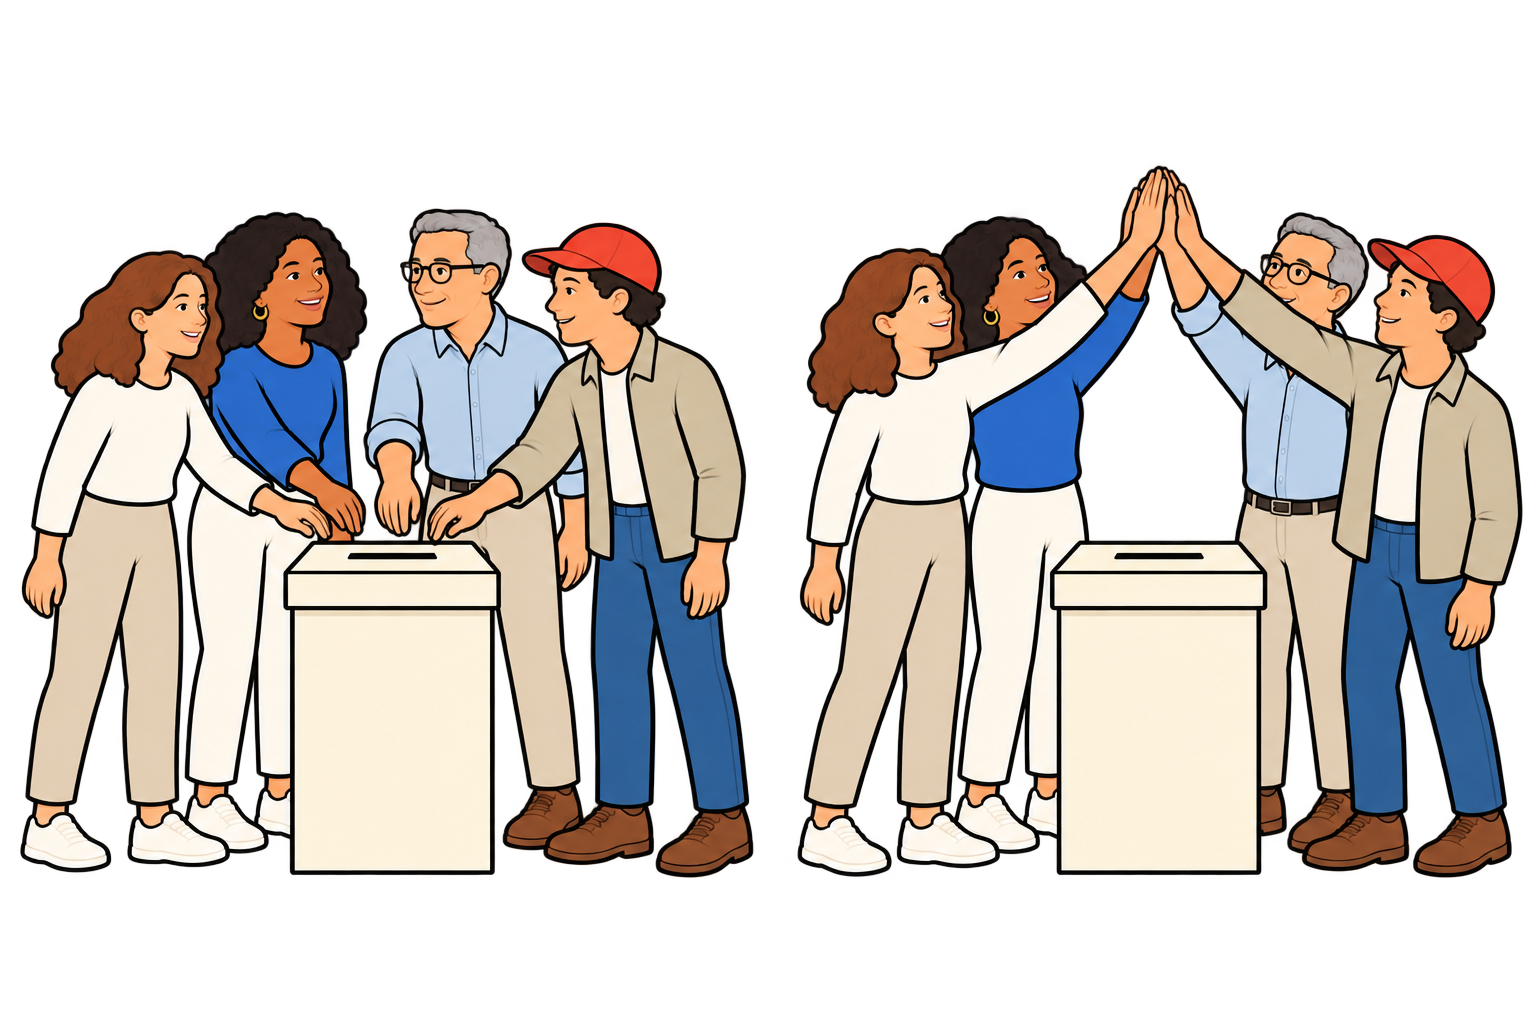
The first two scenes are illustrative: four of five people cast ballots while the original Republican stays seated. These character counts are not turnout estimates. The Independent-to-Republican move and red cap are narrative symbols, not an estimate of individual switching.
Two separate moving inputs affect the party shares a poll needs to represent: changes in party composition and differences in turnout. The drawings are conceptual, not quantities or measured transitions. Registration is an indicator, not an interchangeable measure of party identification or vote choice.
The swing-state average of a 3.1 percentage-point Republican registration-margin increase versus 2022 was supplied by David. It has not been independently reproduced for this draft; the state set, observation dates, denominator, and averaging method remain to be documented before publication.
The turnout statement is a directional expectation supplied by David, not a known final 2026 electorate. Current reporting on North Carolina describes strong Democratic early participation, but early-vote shares do not establish final turnout composition nationally. Source: https://www.axios.com/local/charlotte/2026/10/19/north-carolina-early-voting-2026-democrats-gop . Additional context: https://apnews.com/article/44df2c18b387d28022dbb480e99feaba .
The two indicators can move in different directions: registration can become more Republican while differential turnout increases Democrats’ share of those who vote.
Why polls get party shares wrong
2Getting turnout predictions wrong
✓
What we do know
Multiple signals point to a larger Democratic share of voters than in 2022.
The first two scenes are illustrative: four of five people cast ballots while the original Republican stays seated. These character counts are not turnout estimates. The Independent-to-Republican move and red cap are narrative symbols, not an estimate of individual switching.
Two separate moving inputs affect the party shares a poll needs to represent: changes in party composition and differences in turnout. The drawings are conceptual, not quantities or measured transitions. Registration is an indicator, not an interchangeable measure of party identification or vote choice.
The swing-state average of a 3.1 percentage-point Republican registration-margin increase versus 2022 was supplied by David. It has not been independently reproduced for this draft; the state set, observation dates, denominator, and averaging method remain to be documented before publication.
The turnout statement is a directional expectation supplied by David, not a known final 2026 electorate. Current reporting on North Carolina describes strong Democratic early participation, but early-vote shares do not establish final turnout composition nationally. Source: https://www.axios.com/local/charlotte/2026/10/19/north-carolina-early-voting-2026-democrats-gop . Additional context: https://apnews.com/article/44df2c18b387d28022dbb480e99feaba .
The two indicators can move in different directions: registration can become more Republican while differential turnout increases Democrats’ share of those who vote.
Why polls get party shares wrong
3Double counting
’22/’24 top issueThreats to democracy
’22/’24 top issueThreats to democracy
✓
Unexpected finding
Label recategorization, not voter realignment
Some of the most reliable Democratic voters now identify as Independents.
Editorial interpretation: some of the most reliable Democratic voters now identify as Independents. This is a change in party label rather than evidence of a change in vote alignment. The duplicated character is a conceptual illustration of recategorization, not proof of duplicate survey records. The duplicate represents the same respondent counted in two party categories. The original remains in the Democratic category while a second entry appears in the Independent category. Both entries remain in the sample. This illustrates double counting, not a change in the respondent’s political alignment. The scene does not quantify the frequency of the finding.
Why people answer
Answering a poll used to be civic expression.
Then
Few polls. Editors decided what ran. Civic habit was enough to get people to pick up.
Then: answering a poll was civic expression. There were few polls, editors decided what ran, and civic habit was enough to get people to pick up.
The main drivers of who answered, like age, gender and education, were visible and benchmarkable. The census and voter files show the right mix, so weighting fixed it.
Why people answer
Now there’s a new incentive: feeding the narrative.
Then
The incentive was civic expression. Few polls, and editors decided what ran.
Now
The new incentive is feeding the narrative. The feed never turns off, and every answer shapes the story.
Now: answering feeds the narrative. The feed never turns off, and every answer shapes the story.
Polls are now part of an always-on political story that matters a lot to some people. For some, that creates an incentive to answer and support their side. Others stop answering, especially when their side is losing.
Why people answer
Same party, same story, different willingness to answer.
Answers
The poll story gives her a reason to pick up.
Tunes out
The same story gives her a reason to tune out.
Same party ID. Same narrative. Different willingness to answer. Both groups still vote.
You can't benchmark which type of person reacts which way, because these differences run inside each party and each demographic group.
We call this hidden nonresponse.
Why people answer
Other dynamics move response rates, too.
The turnoff
When the polls look like a blowout, people on the losing side stop answering.
The tune-in
As Election Day gets close, people of every type start answering again.
Hidden nonresponse isn't the only thing moving response rates. Two other dynamics matter, and in late October they pull against each other.
We think there's a turnoff point. When the polls start to look like a blowout, people on the losing side are more likely to ignore the next text or call, like fans who turn off a football game when their team is down by 21 in the third quarter. Most of those fans still watch next week, and most people who ignore a poll still vote.
Then, as Election Day gets close, people tune back in. The election feels real, more people of every type have a reason to answer, and the gaps in who responds shrink.
Right now, in late October, both forces are at work at the same time. That's why pollsters can point to their final polls and say they weren't that bad.
But campaigns and outside groups make their biggest decisions, and spend hundreds of millions of dollars, in the summer and September. Judged by the polls from those months, the record looks worse.
Why people answer
In Pennsylvania, with no close race, the bias mostly disappeared.
Close-race states
A close statewide race and a constant poll story
The people who came back were the wrong mix within each party
Results tilted toward Democrats
Pennsylvania our control
No close statewide race, so little poll story
The people who came back nearly matched everyone we invited
No clear tilt
Same study, same weighting. The bias shows up where the political story gives people a reason to answer, or to tune out.
Pennsylvania is our control. We ran the same recontact and the same weighting there, but Pennsylvania has no close statewide race this year, so there's little political story pulling people in or pushing them out.
In the close-race states, the people who came back were the wrong mix within each party, and the results tilted toward Democrats. In Pennsylvania, the people who came back nearly matched everyone we invited, both on the margin and on strong Trump supporters.
That's the strongest sign that this is about the political story, not about the people or the method.
Why it matters
Bad polls misrepresent voters. And no one likes paying $1.2 billion for landslides.
Spending: candidates and outside groups, from OpenSecrets and news reports. A + means at least; Florida and Texas count candidate spending only.
Polls have a lot of practical uses, so if they're off for 23 of every 24 months in a cycle, that's a real problem. Elected officials need to know what people actually think to do their jobs well.
In the final stretch before the election, we're running large polls in many states built for nonresponse checks, and we'll check what AI finds against the results.
It doesn't mean every state has a 3.3-point error. Some could be close to that, others a little less and others a lot more.
The fix
How do we fix it? Find the symptoms we can benchmark.
Too many
Polls reach too many people from places with this profile.
Too few
And too few from places like this. That mix we can measure and correct.
So how do we fix it? We have to find symptoms of hidden nonresponse that we can benchmark.
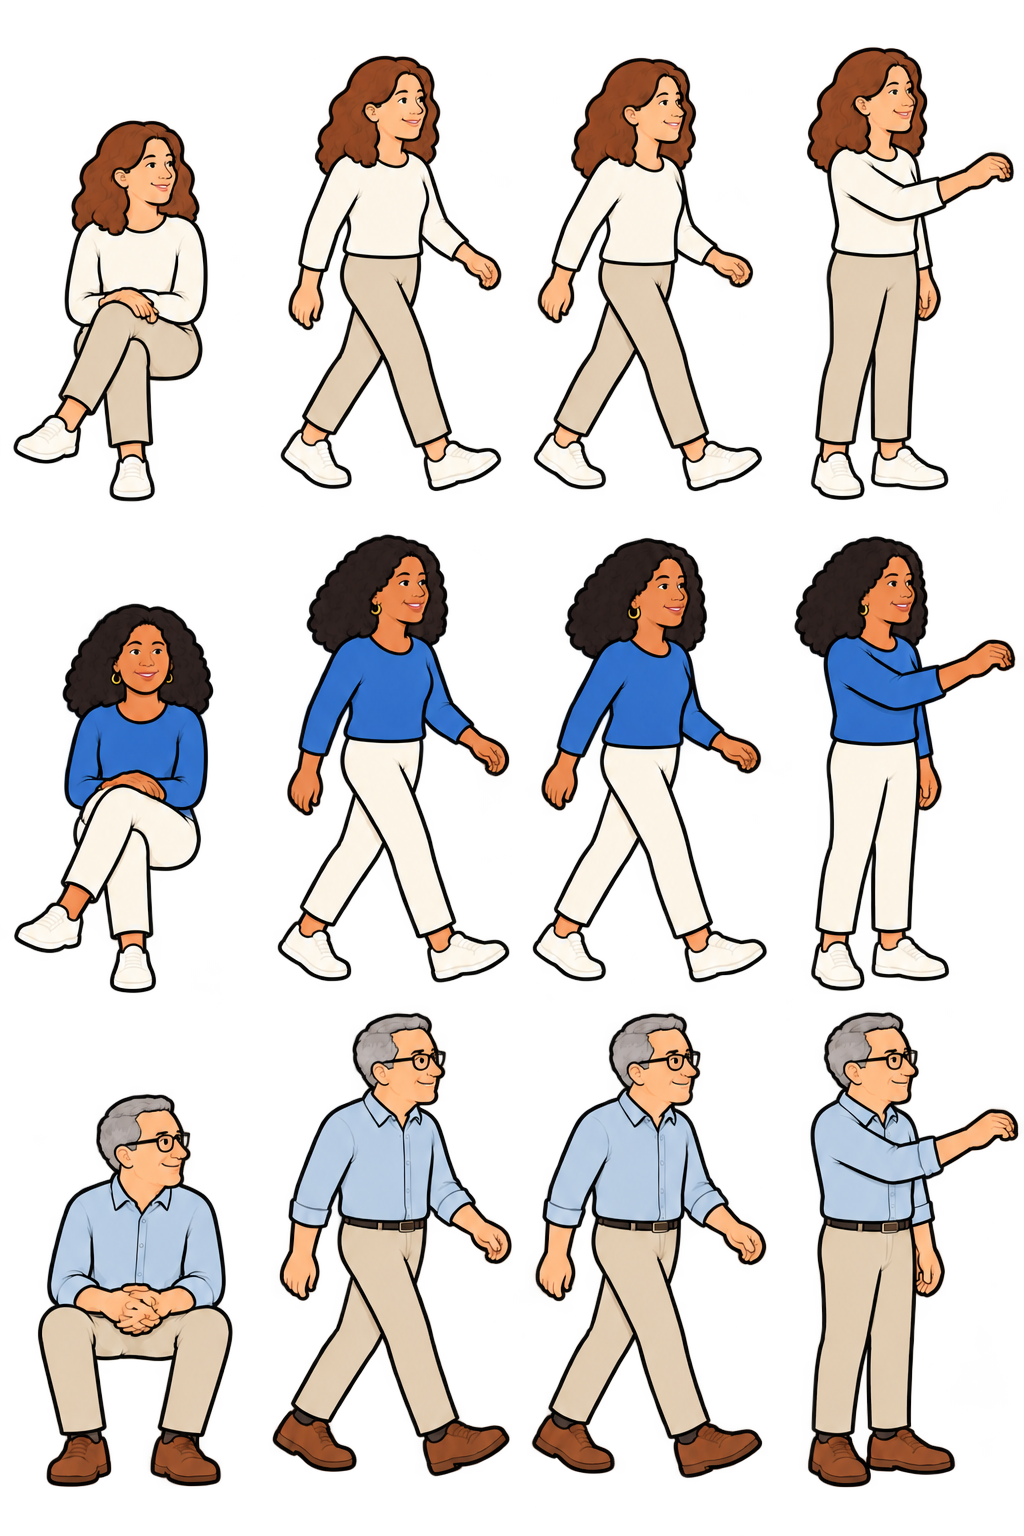
These two women are both Democrats, both moderate, both suburban. A standard poll treats them the same. But one answers polls and the other doesn't, and they live in different kinds of places.
Some symptoms can't be benchmarked. No census or voter file says how many voters rank threats to democracy as their top issue, so there's nothing to weight it to.
Where people live is different. Polls get too many people from places like the first one, with higher education, health care and economic measures, and too few from places like the second. There are hard statistics on every community, so that mix is something we can measure and correct, even inside the same suburbs.
That's the work ahead: find which community measures track who answers, then check whether matching on them brings the ballot error down. Illustrative profiles, not data.
Thank you
Read the full report.
wick.io/research-hidden-nonresponse-2026-polls
About David Burrell
Co-founder of Wick. David has spent 18 years in polling, building innovations in how surveys reach people and measure what they think. He lives in Georgia with his wife, Monica, and their five kids: Shepherd, Bear, Owen, and twins Johnny and Evelyn.
About Wick
Wick started in political polling, and its election work has been recognized among the most accurate across multiple cycles. Today, Wick turns survey, customer and voter data into governed, model-ready intelligence and connects it to the AI tools people already use, like ChatGPT and Claude. Wick is a multi-year Inc. 5000 fastest-growing company.
Thanks for watching. The full report, with the tables and the limits, is on wick.io.
Wick's election work has been recognized among the most accurate across multiple cycles, and Wick is a multi-year Inc. 5000 fastest-growing company.
Appendix
Supporting tables & details
The full comparisons behind the main story.
A1The weighted sample matches
A2The mix within each party
A3Why the mix changes the ballot
A4The measured bias
A5Party recategorization
Supporting evidence is collected here so the presentation can follow the three illustrated sections without stopping for the detailed tables. The five supporting data slides remain in the deck. Their values and original source notes are preserved.
A1Right share
At first glance, this looks like the perfect sample.
So the overall numbers match. But what types of people are in each group?
We weighted the recontact responses to the original survey answers of everyone we invited. They match exactly on age, sex, race, education, urbanicity, party, ideology and 2020 vote recall. A typical pre-election poll can't do this.
Every row: same number, zero error.
A2Wrong mix
The mix is off in ways that matter, and there’s no benchmark to weight to.
These aren't small differences. These groups vote differently and see Trump differently, so getting their mix wrong moves the results.
Even after weighting, the recontact responses overrepresent certain types of Democrats, Independents and Republicans.
Democrats whose top issue was threats to democracy: 47.9% of everyone invited, 56.6% of the weighted responses.
Moderate Independents: 49.5 vs 57.4.
Vaccinated Republican men: 49.7 vs 63.4.
Those differences matter because these subgroups hold different political views from others in their party.
A3Biased ballots
The wrong mix tilts the ballot in favor of Democrats.
Why does the mix matter? These groups see Trump and vote very differently from others in their party, and they still do today. The 2026 survey asked everyone the same questions, so we can compare them directly.
Each group is defined by its answer in the original poll. Both measures come only from the 2026 survey.
Democracy-first Democrats: 0% approve of Trump, vs 9.4% of other Democrats.
Moderate Independents: 28.1% approve vs 41.5%; 32.4% would vote Republican for the House vs 54.2%.
Vaccinated Republican men: 69.9% approve vs 82.9%; 74.8% would vote Republican vs 90.5%.
If these groups come back too often again, 2026 polls would likely lean the same way.
A4How much bias
The recontact yielded a bias of 3.3 points toward Democrats.
Even weighting to results we already had couldn't eliminate it. And Pennsylvania, the one state without a close race, was the only state that didn't follow the pattern.
Because the weighted responses include a different mix of people within key groups, they report a more Democratic top-of-ticket result and lower Trump favorability than the larger sample.
Top-of-ticket margin: everyone invited R+1.7, weighted responses D+1.7, a 3.3-point error toward Democrats.
Trump net favorability: −3.9 vs −7.1, 3.2 points too low.
The margin row blends the 2024 presidential race with the 2022 Senate or governor race. Read each row's error, not its level.
A5One more thing we didn't expect
The most consistent Democrats now say they’re Independents, but still vote D.
That makes Independents look more Democratic than they are. And a poll weighted to party can double count them: once in its full share of Democrats, and again among Independents.
It's a separate problem, but it turned up in the same data, and it also confounds polls.
Democrats whose top issue was threats to democracy are almost three times as likely as other Democrats to call themselves Independents now: 17% vs 6%.
And the ones who switched still vote like Democrats: about 98% Democratic for the House, compared with about half of other Independents. None approve of Trump.
That makes Independents look more Democratic than they are, and a poll that weights to an older party ID target counts these voters in the wrong place.
→ / space next · ← back · F full screen · P presenter notes · B blank
So how do we fix it? We have to find symptoms of hidden nonresponse that we can benchmark.
These two women are both Democrats, both moderate, both suburban. A standard poll treats them the same. But one answers polls and the other doesn't, and they live in different kinds of places.
Some symptoms can't be benchmarked. No census or voter file says how many voters rank threats to democracy as their top issue, so there's nothing to weight it to.
Where people live is different. Polls get too many people from places like the first one, with higher education, health care and economic measures, and too few from places like the second. There are hard statistics on every community, so that mix is something we can measure and correct, even inside the same suburbs.
That's the work ahead: find which community measures track who answers, then check whether matching on them brings the ballot error down. Illustrative profiles, not data.