
The Electorate Atlas
Comprehensive statistics on electorate composition, voting methods, election results, and trends.
 Wick Fabric
Wick brings voter data together with the findings drawn from it and the knowledge to use it—giving AI a connected, governed foundation to reason and act on.
Data products
Voter records, population statistics, and original surveys. Bring together the sources that matter to your work.
Comprehensive statistics on electorate composition, voting methods, election results, and trends.
Voter-level data for research, analysis, and outreach. Explore audiences, compare voters, and build lists.
Monthly research with 3,000 likely voters. Free public data, sponsored by the Bradford Family Foundation.
Texas Postmortem: a closer look at Texas voters after the November 2026 election.
A proposed survey of 3,000 people across battleground states. Knock on doors. Hear directly from voters.
Polling

Show people the day’s videos, posts, and headlines. Measure their reactions—with findings targeted for the next morning.
Polling
Comprehensive statistics on thousands of electorates.
Voter records and official election results, transformed into precomputed statistics. Organized by place, electorate, and election. Searchable, with the context to understand what the numbers mean.
The detail within each electorate. One-, two-, and three-way tabulations reveal its composition and voting methods. Official results show how it voted, from the top of the ticket to local contests.
The changes between elections. Follow shifts in turnout, composition, and support across years. See where the electorate is changing—and bring the evidence into your analysis.
Monthly national voter research
Follow the race. Understand what’s moving it.
Every month, 3,000 likely voters tell us who they support, what’s on their minds, and why. Follow the primary races and potential general-election matchups—with the data to look beyond the toplines.
Democratic and Republican contenders, tracked through the conventions. See where support is growing—and which voters are driving it.
Hypothetical general-election ballots. Compare how different candidates perform with the same groups of voters.
The priorities, headlines, and events shaping opinion. Explore how they connect to candidate support and turnout intentions.
Survey responses are enriched with additional variables, tabulations, statistics, and model outputs—so you can explore the patterns behind the results.
Wave 1 draft: the races, the issues, and the voters behind them.
A monthly survey deep dive into the electorate.
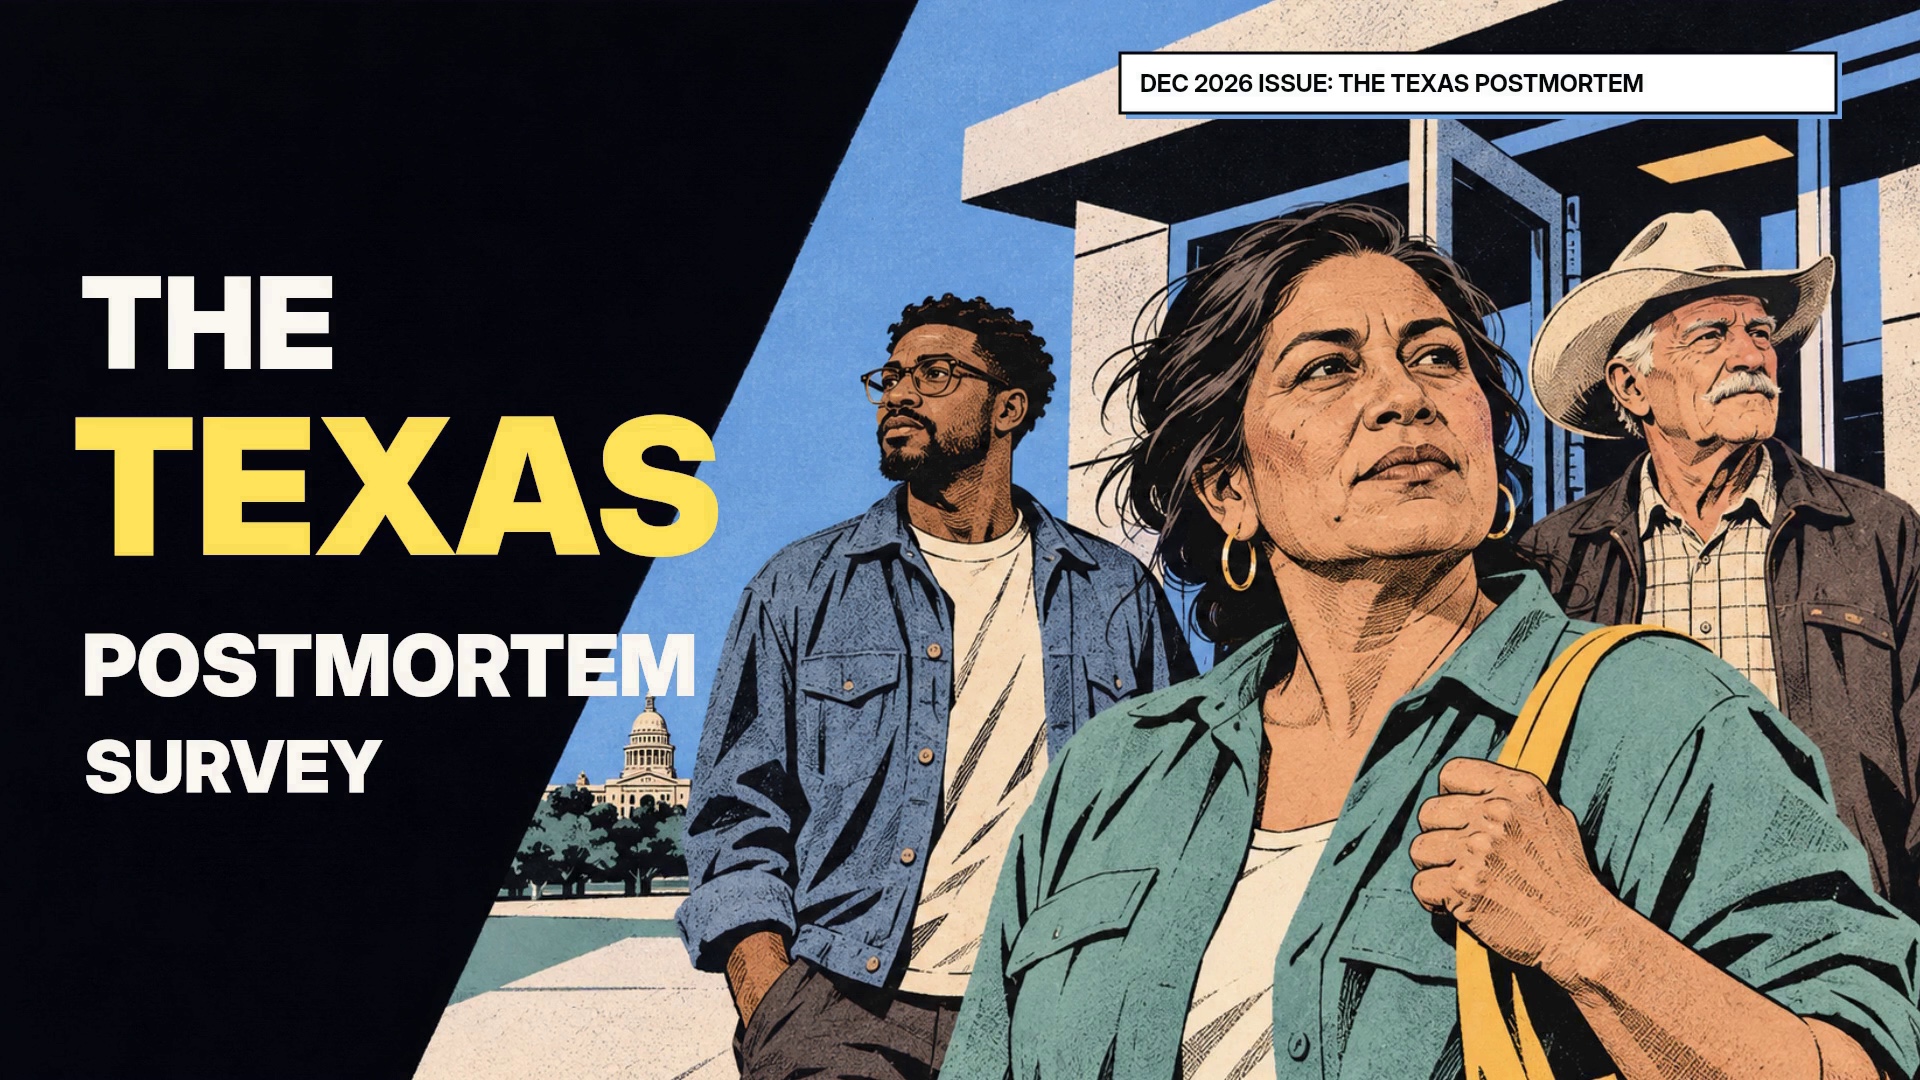
A post-election study of Texas voters: who crossed party lines, what drove their choices, and what the result means for 2028.

What drove Gen Z’s swing left—and how much came from changed votes versus changes in who turned out?

What kept Republican voters home in 2026—and what would bring them back?
The February topic will be announced.
The March topic will be announced.
The April topic will be announced.
Get access
Fabric is the shared data foundation behind Wick Gateway and Wick Enterprise. Choose how you want to use it.
 Wick Gateway
Connect your AI to Fabric and included analytical tools. Ask questions, run analyses, and get reports and voter files back.
Explore Gateway Wick Enterprise
Everything in Gateway, plus a private environment for your data, models, and workflows—with dedicated Wick experts on your team.
Explore Enterprise