

The topline
Even with best-case weighting, a hidden bias made our respondents too favorable to Democrats and not favorable enough to Trump.
- Top-of-ticket margin3.3 ptstoo Democratic
- Trump net favorability3.2 ptstoo low
The problem
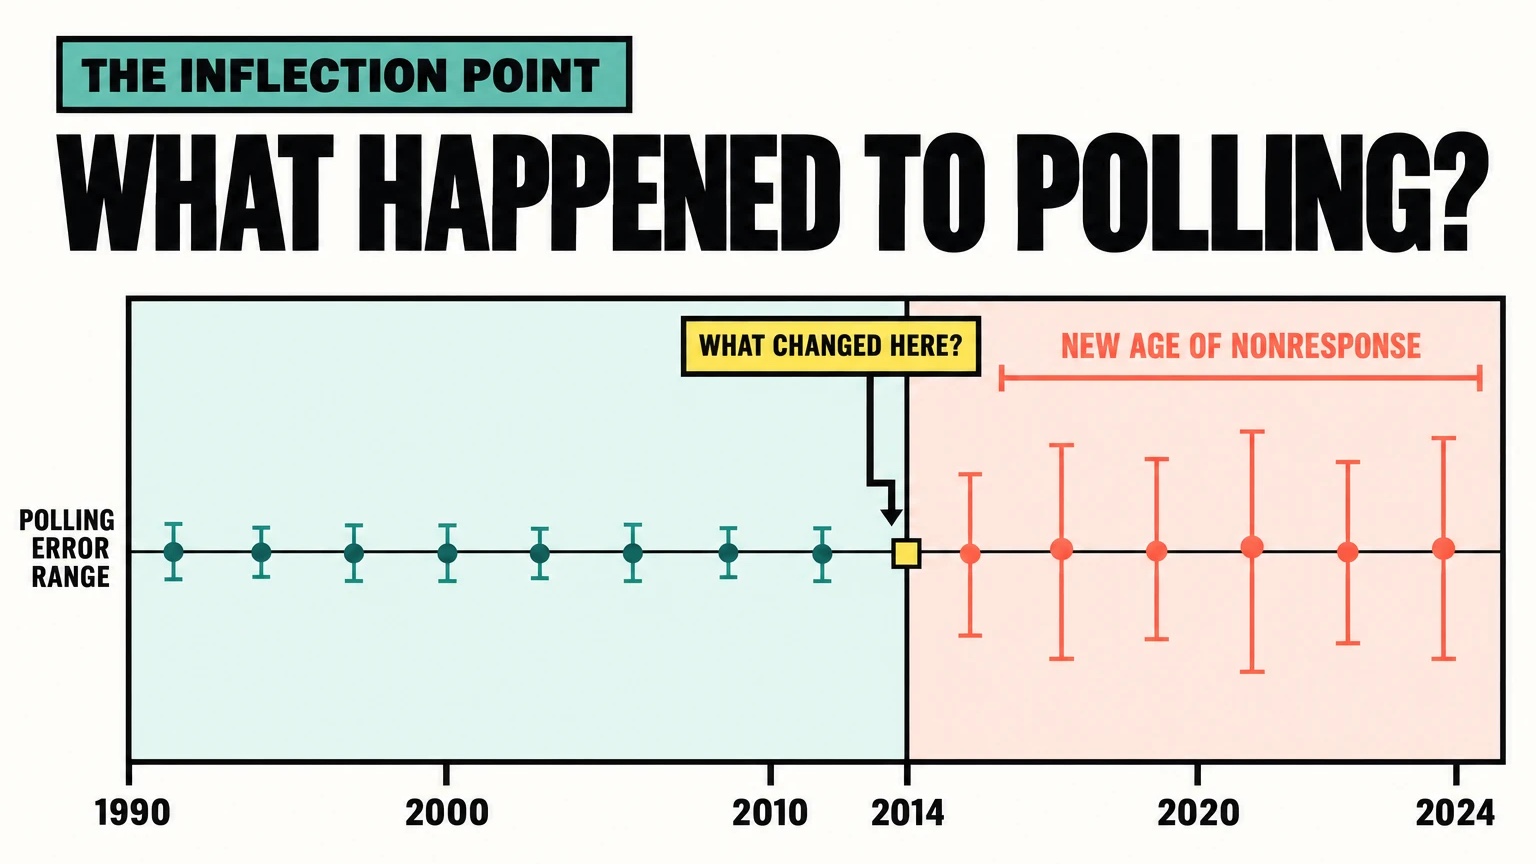
A new, hidden nonresponse bias is skewing who polls say is winning.
Even when a poll's data sample is random, the respondent sample never is. Pollsters correct for this in several ways, and it largely works because the main drivers of who responds, like age, gender and education, aren't just visible. They're benchmarkable: the census and voter files show the right mix.
But what about the drivers you can't see? Polls are now part of an always-on political story that matters a lot to some people. For some, that creates an incentive to answer and support their side. Others stop answering, especially when their side is losing. Same stimulus, different reactions. And you can't benchmark which type of person reacts which way, because these differences run inside each party and each demographic group. We call this hidden nonresponse.
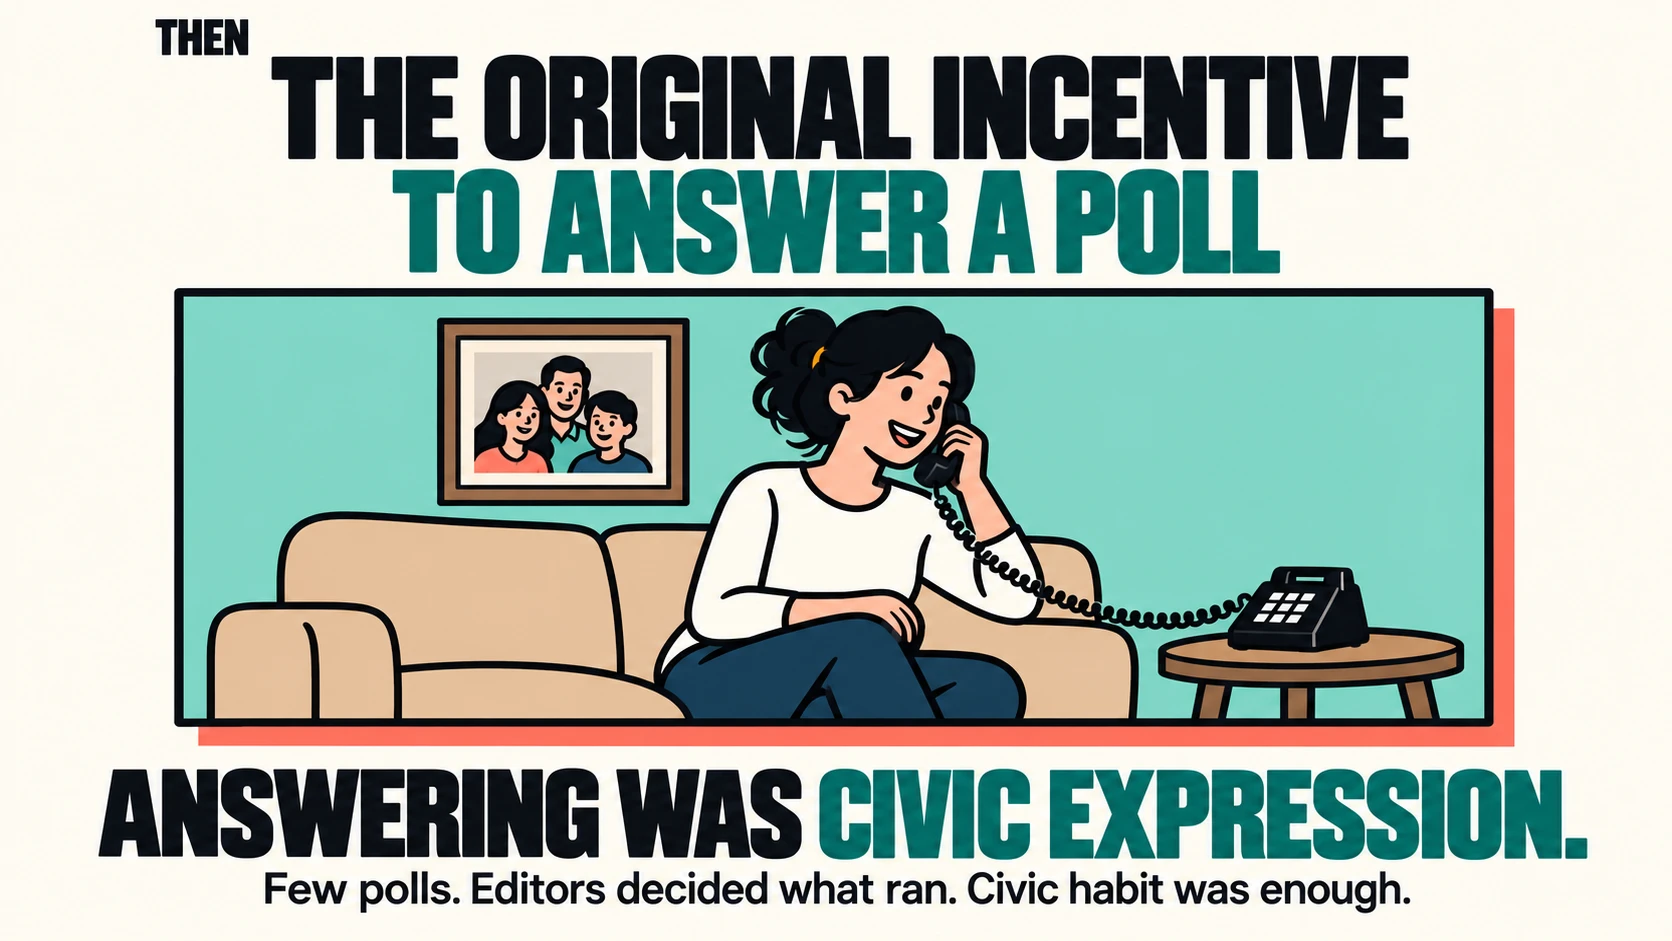
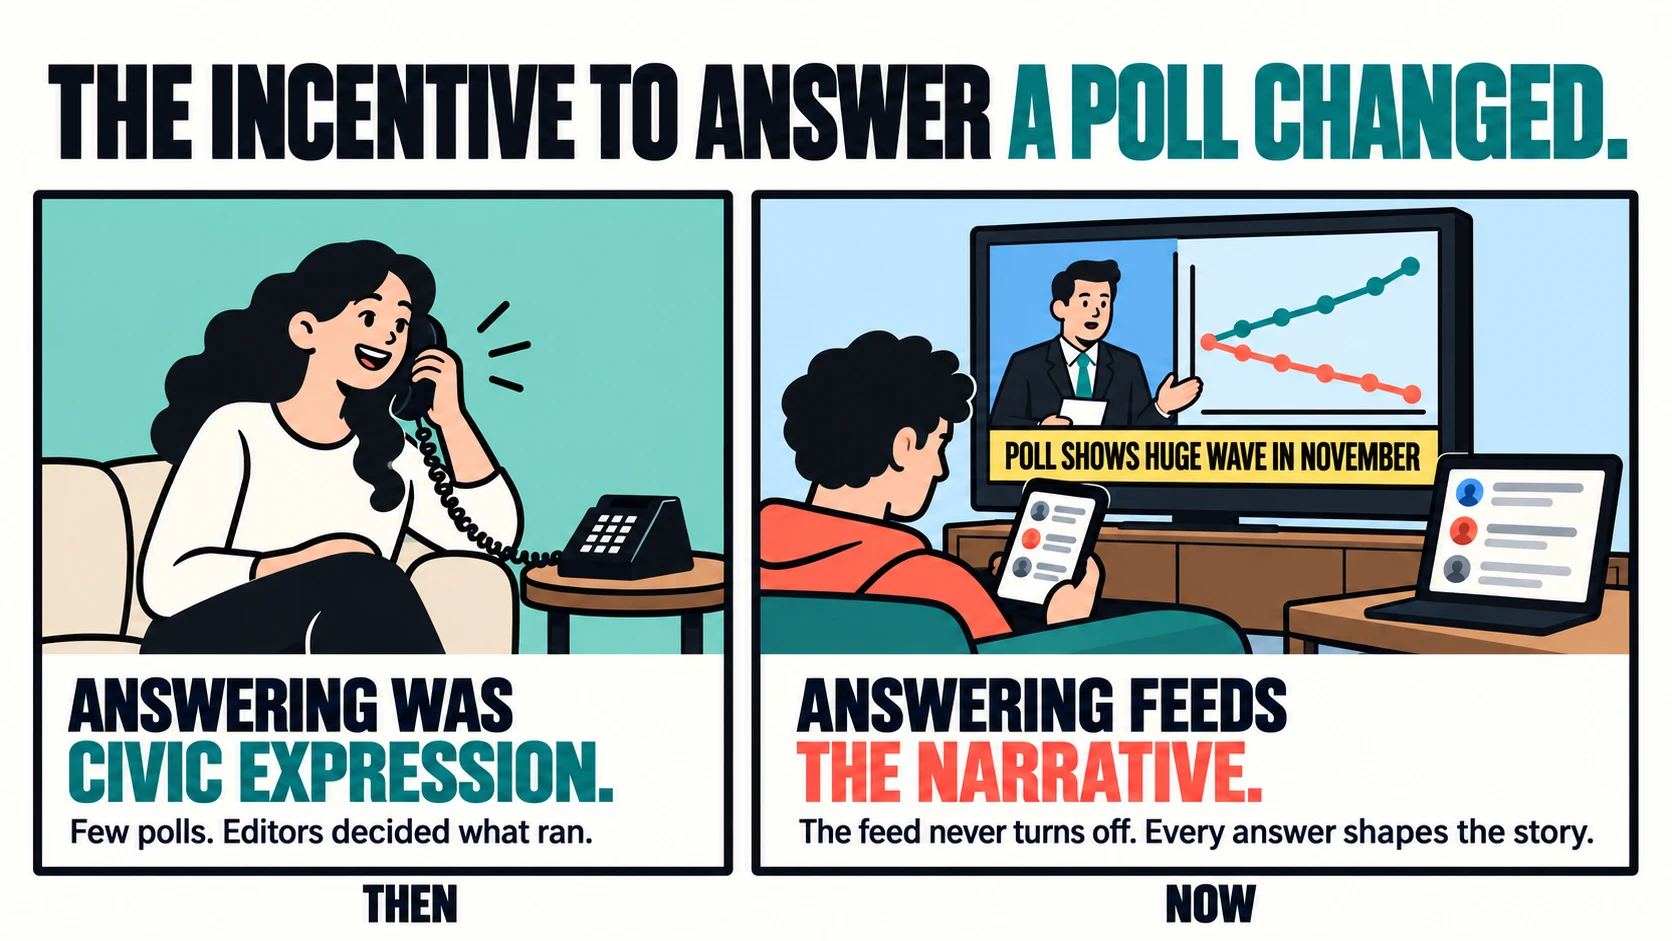
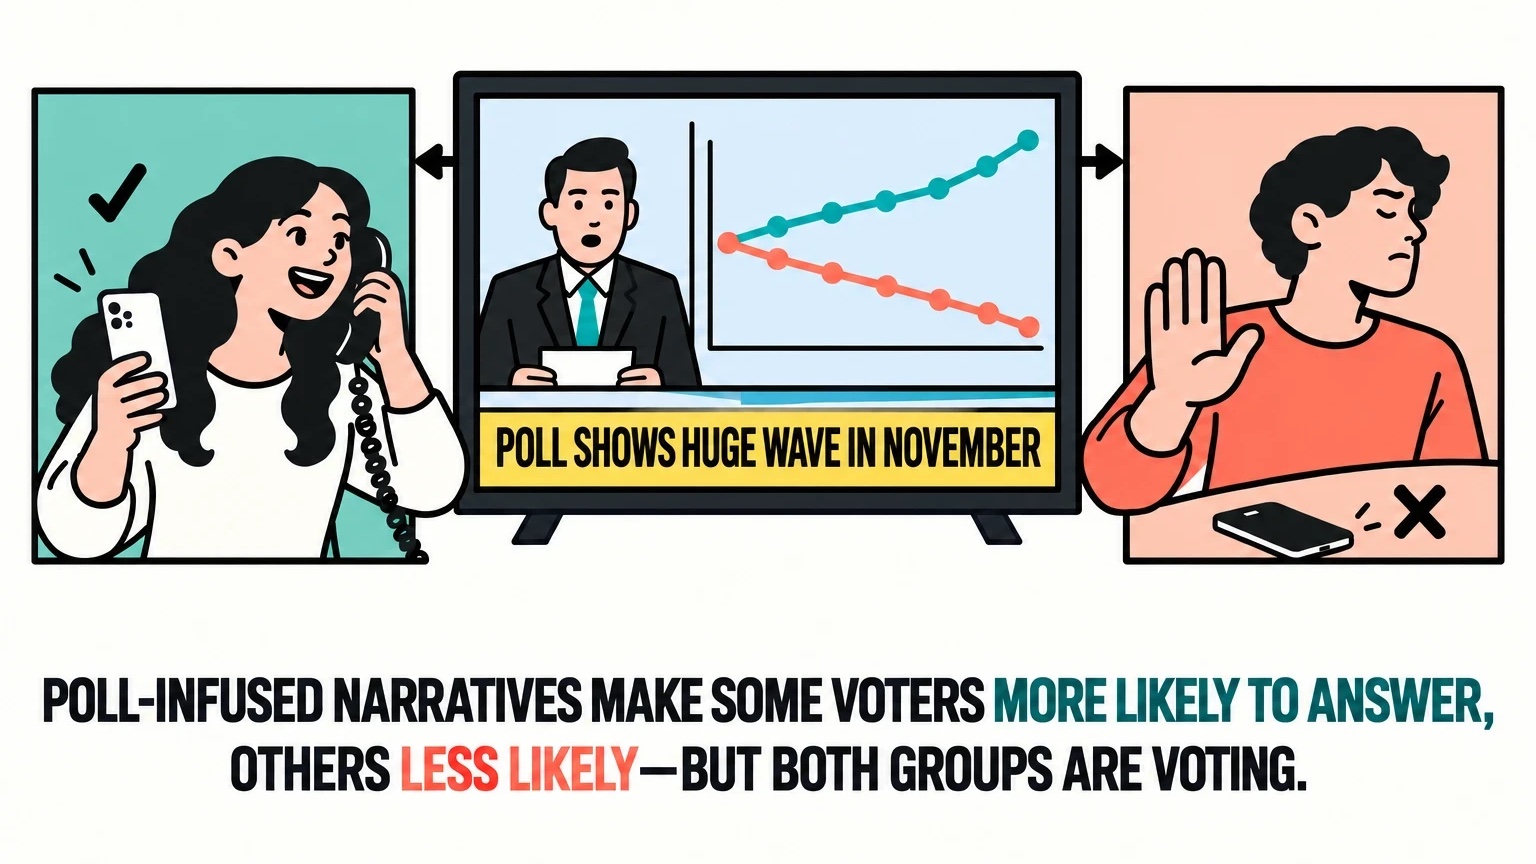
We also think there's a turnoff point. When the polls start to look like a blowout, people on the losing side are more likely to ignore the next text or call, like fans who turn off a football game when their team is down by 21 in the third quarter. Most of those fans still watch next week, and most people who ignore a poll still vote.
Then, as Election Day gets close, people tune back in. The election feels real, more people of every type have a reason to answer, and the gaps in who responds shrink. That's why pollsters can point to their final polls and say they weren't that bad. But campaigns and outside groups make their biggest decisions, and spend hundreds of millions of dollars, in the summer and September. Judged by the polls from those months, the record looks worse.
We had seen signs of this for years but never tested it. Earlier in October, we decided to run a recontact study: go back to people who had already taken our polls and see whether it's really happening.
The experiment
We went back to 16,358 people from accurate polls to see which kinds of voters answer.
This analysis compares the people who responded to our recontact survey with everyone we invited to take it, using the answers they gave in our earlier polls.
We started with accurate polls
We used our 2022 and 2024 text-to-web polls in Arizona, Florida, Georgia, Michigan, North Carolina, Pennsylvania, South Carolina and Tennessee: 16,358 respondents, mostly from mid-to-late October.
Pennsylvania was the control
Our theory is that close top-of-ticket races (not local or even congressional races), and the polling-infused, always-on political narrative that comes with them, change who answers. Pennsylvania has no close Senate or governor's race this year, so if we're right, the gap should be smaller there.
We sent them a recontact survey
2,384 people responded, or 14.6%. That is well above the 1% or 2% typical for a new poll, because they had taken our surveys before. It also means the study can't show how people respond the first time they're contacted.
We weighted them to match everyone we invited
We weighted the respondents on age, sex, race, education, party, ideology and the 2020 vote recall question to the exact makeup of everyone we invited. A real poll never knows that makeup, so this is the best case for weighting. We call it the cheat code.
What weighting missed is the hidden error
For example, after weighting, the respondents had exactly the right share of Republicans and of conservatives. But too few of the Republican men were unvaccinated, and those men are much warmer to Trump than other Republicans. Likely as a result, the main outcomes, the ballot and Trump's favorability, both missed. Gaps like that are the hidden error: error that weighting can't fix.
Limits to keep in mind
We didn't design these polls to study nonresponse. We went back to polls we had already run to see if the problem showed up. That means a few limits shape how to read the findings.
- The questionnaires weren't the same. The polls were written at different times for different races, so question wording, answer options and the number of people asked each question vary.
- The data is pooled across states and districts. We combined statewide polls with congressional and state legislative district polls from several states, and the margin row blends the 2024 presidential race with the 2022 Senate or governor race. Read each row's error, not its level.
- Pennsylvania is one state. It gave us a good-sized sample, 510 people who took the recontact survey, but one state can't make a true control. That makes this comparison pseudo-experimental at best.
The findings
After weighting, the people who answered still leaned 3.3 points toward Democrats.
The tables below compare the people who took the recontact survey with everyone we invited, using their answers from our earlier polls. They tell the story in three steps. The rows are examples we picked to show what's happening, not the complete findings. Weighting got the shares right, so the top rows match exactly. But the mix inside each group was off, in a way that tracks the results. Democrats who put threats to democracy first and Independents who called themselves moderate came back too often, and both lean further toward Democrats than others in their party group. Unvaccinated Republican men, who are far warmer to Trump than other Republicans, came back too rarely. So the results missed, as the bottom rows show.
Right shares, wrong mix, biased results
You can weight a survey to match key benchmarks and still get the wrong answer if the people within those groups aren't representative.
Everyone we invited compared with the people who took the survey, weighted to match everyone we invited exactly on age, sex, race, education, party, ideology and 2020 vote recall, and the error in points. Weightable rows and outcomes average our 2022 and 2024 polls in states with a close statewide race this year, each year counted equally; the top-of-ticket margin averages the 2024 presidential race and the 2022 Senate race, or governor where there was no Senate race. Rows in the second group are from all our 2022 polls.
At first glance, this looks like an extremely well-weighted survey.
After weighting, the recontact responses match the larger data sample exactly on age, sex, race, education, party, ideology and 2020 vote recall.
| Measure | Gap chart | Data samplen = 16,358 | Weighted responsesn = 2,384 | Error |
|---|---|---|---|---|
| Men | 49.8 | 49.8 | 0.0 | |
| Women | 50.2 | 50.2 | 0.0 | |
| Republicans | 37.3 | 37.3 | 0.0 | |
| Democrats | 29.1 | 29.1 | 0.0 | |
| Independents | 28.1 | 28.1 | 0.0 | |
| Moderates | 30.4 | 30.4 | 0.0 | |
| 2020 vote recall: Trump | 48.2 | 48.2 | 0.0 |
So the overall numbers match. But what types of people are in each group?
The mix inside each group is different.
Even after weighting, the recontact responses overrepresent certain types of Democrats and Independents and underrepresent certain types of Republicans.
| Measure | Gap chart | Data samplen = 16,358 | Weighted responsesn = 2,384 | Difference |
|---|---|---|---|---|
| Democrats whose top issue was threats to democracy | 47.9 | 56.6 | +8.8 | |
| Independents who called themselves moderate | 49.5 | 57.4 | +7.9 | |
| Republican men who were unvaccinated | 50.3 | 36.6 | −13.7 |
These differences matter because they're related to how people vote and view Trump.
As a result, the survey produces more Democratic results.
Because the weighted responses include a different mix of people within key groups, they report a more Democratic top-of-ticket result and lower Trump favorability than the larger sample.
| Measure | Gap chart | Data samplen = 16,358 | Weighted responsesn = 2,384 | Difference |
|---|---|---|---|---|
| Top-of-ticket margin | R+1.7 | D+1.7 | D+3.3 | |
| Trump net favorability | −3.9 | −7.1 | −3.2 |
After weighting, the top-of-ticket margin was 3.3 points more Democratic than it should have been, and Trump's net favorability was 3.2 points too low. The miss was largest among Republicans: the share very favorable to Trump was 8.2 points too low. That error comes on top of the usual margin of error.
The Pennsylvania control backs this up. Among people from our Pennsylvania polls, where there's no close statewide race this year, the pattern reverses. With the same weights, the Democratic overperformance on the ballot and the undercount of Trump's favorability disappear. Among the states with enough responses to read, Pennsylvania is the only one where the results leaned toward Republicans and Trump instead. That fits the idea that exposure to a close race story drives hidden nonresponse. It's one state, so we'll test the pattern more widely.
The takeaways
- What it means There is an error that even the best possible weighting can't correct, and it leans toward Democrats and against Trump. Pennsylvania, the one state without a close race, didn't show it. That suggests our theory could be right: a close race and the polling-driven story around it give some people a reason to answer and others a reason to tune out.
- What it doesn't mean It doesn't tell us what polls looked like in August, or what they will look like in late October, when we think this error starts to fade as more people tune in and early voting data helps pollsters adjust. It also doesn't mean every state has a 3.3-point error. Some states could be close to that, others a little less and others a lot more. We have enough data to see the pattern when we pool the states together, but not enough to say much more about any one state yet. This study was a boxing match, not a symphony. At first glance, the data suggests the error is bigger in Florida than in Georgia, but there isn't enough data behind either state to say.
- Why it matters Polls have a lot of practical uses, so if they're off for 23 of every 24 months in a cycle, that's a real problem. Elected officials and governments need to know what people actually think to do their jobs well. And money follows polls. Campaigns and outside groups spend billions of dollars a cycle, much of it based on which races the polls say are close. No one wants to spend a fortune on a race that looks close and ends up a landslide. They'd rather know it isn't competitive and put the money somewhere else.
- What's next We'll document and validate this dataset and put the full evidence on the Wick platform, with its governance, guardrails and limits spelled out. Wick customers will be able to connect ChatGPT, Claude or another AI tool through our MCP server. How we plan to fix the problem is in the next section.
The fix
AI gives us a chance to fix hidden nonresponse before 2028.
Right now, there is very little pollsters can do about error like this. Fixing it means rethinking which population benchmarks we use and how we use them in sampling, quota management and weighting. That is more work than any team of people can do by hand.
Work on that scale is what AI is starting to do. This summer, a mathematician working with AI settled a math problem that had been open since 1939, and a computer checked the proof overnight. AI can reason through a problem, use tools, and generate and test ideas at a scale people can't.
We saw it on this project. Without AI, getting the data ready and doing the analysis would have taken two weeks. The first pass took under an hour, and a second set of AI agents rebuilt the numbers from the raw files to check them.
This study was encouraging enough that we're designing one built for this question. Over the next two weeks, the final stretch before the election, when we believe polls are most accurate, we'll run large polls in many states with questionnaires designed for nonresponse checks. That data will be our starting point for finding which datasets and questions can serve as population benchmarks. With the right infrastructure and governed access to that data, AI can test far more possible benchmarks than a person could, find the ones that track who answers, and check them against real election results. Our goal is to have it ready for the 2028 cycle.